Portugal: A Macroeconomic Risk Analysis
Abstract
This blog post presents an innovative and comprehensive analysis of Portugal’s macroeconomic performance over the period 1970–2005. By integrating classical economic theory with advanced econometric modeling—including Vector Autoregression (VAR) and ARIMA approaches—we examine the intricate interplay between GDP growth, unemployment, and inflation. Our study revisits the traditional Phillips Curve framework and proposes an accelerated variant to better capture the nuances of Portuguese economic dynamics. The analysis not only identifies key recession periods but also offers robust policy implications for economic stabilization and investment strategy formulation.
Introduction
The global economic landscape has been transformed by unprecedented shocks—from the oil crises of the 1970s to the financial disruptions of the early 21st century. Against this backdrop, Portugal’s economic evolution from 1970 to 2005 provides a fertile ground for in-depth macroeconomic analysis. This blog post seeks to bridge classical macroeconomic theory with modern econometric techniques, offering a groundbreaking approach to country risk analysis. We critically assess traditional models of business cycles, test the validity of Okun’s Law, and re-examine the Phillips Curve in the context of structural shifts and external shocks. The insights derived from this study aim to inform both policy decisions and strategic investment frameworks.
Theoretical Framework and Literature Review
Classical Theories and Modern Adaptations
GDP Growth and Business Cycles:
Economic theory postulates that sustained GDP growth is central to macroeconomic stability. We define annual GDP growth as:
$$ \Delta GDP(t) = \frac{GDP(t) - GDP(t-1)}{GDP(t-1)} \times 100%. $$
With a long-run average of approximately 3.5% for Portugal, deviations below this benchmark signal recessionary periods.Unemployment Dynamics and Okun’s Law:
Okun’s Law suggests a statistically significant inverse relationship between GDP growth and unemployment. This relationship forms the basis for our recession indicator, where a decline in GDP is followed by a lagged increase in unemployment.Inflation and the Phillips Curve:
The traditional Phillips Curve, which posits an inverse relationship between inflation and unemployment, is revisited. However, structural changes and external shocks in Portugal’s economy necessitate an alternative approach—specifically, an accelerated Phillips Curve that focuses on the change in inflation:
$$ \Delta \pi(t) = \pi(t) - \pi(t-1). $$
Literature Synthesis
A review of seminal works in macroeconomic theory and empirical studies reveals:
- Structural Breaks: Literature emphasizes the impact of exogenous shocks (e.g., the 1979 energy crisis, the 1990 oil price shock) on macroeconomic stability.
- Modeling Innovations: Recent studies advocate for integrating VAR and ARIMA models to capture dynamic interdependencies among economic variables.
- Policy Implications: Research underscores the importance of timely monetary and fiscal interventions to mitigate recession impacts, a theme explored through the lens of the Taylor Rule.
Data and Methodology
Data Sources and Period
Our analysis utilizes a comprehensive dataset covering Portugal’s economic indicators from 1970 to 2005, sourced from the World Bank and national statistical agencies. Key variables include:
- Real GDP
- Unemployment Rate
- Inflation Rate
Methodological Framework
Econometric Techniques
Ordinary Least Squares (OLS) Regression:
Used for baseline estimations of the GDP-unemployment-inflation relationships.Structural Break Tests:
Implemented to detect regime shifts, particularly around crisis periods such as the early 1980s recession.Vector Autoregression (VAR):
Employed to capture the dynamic interplay among GDP growth, unemployment, and inflation. Impulse response functions (IRFs) are derived to understand the effect of exogenous shocks.ARIMA Modeling:
Utilized for forecasting purposes, enabling a robust assessment of future recession risks.
Construction of the Recession Indicator
A recession is identified when:
- The annual GDP growth falls below the long-run average (≈3.5%).
- An increase in unemployment is observed with a lag consistent with Okun’s Law.
We define the recession indicator function ( I(t) ) as: $$ I(t) = \begin{cases} 1, & \text{if } \Delta GDP(t) < 3.5% \text{ and } u(t) \text{ increases},\[1mm] 0, & \text{otherwise.} \end{cases} $$
Diagnostic and Robustness Checks
- Stationarity Testing:
Augmented Dickey-Fuller (ADF) tests confirm the stationarity of our time series data. - Robustness Checks:
Sensitivity analyses are performed by varying model specifications and sample periods.
Empirical Analysis
GDP Growth Analysis
We begin with an in-depth examination of real GDP growth. Using our defined metric, recession years are flagged when growth rates fall below the 3.5% benchmark.

- Figure 1: Real GDP per Capita and Growth Rates (1970–2005)
(Recession periods are highlighted in blue.)
Unemployment and Inflation Dynamics
Unemployment Trends
Empirical analysis confirms that decreases in GDP growth are closely followed by increases in the unemployment rate. Our regression models consistently demonstrate the validity of Okun’s Law in the Portuguese context.
Inflation Behavior
Inflation dynamics are complex and multifaceted. The traditional Phillips Curve fails to fully capture the relationship between inflation and unemployment, particularly during periods marked by structural shocks.
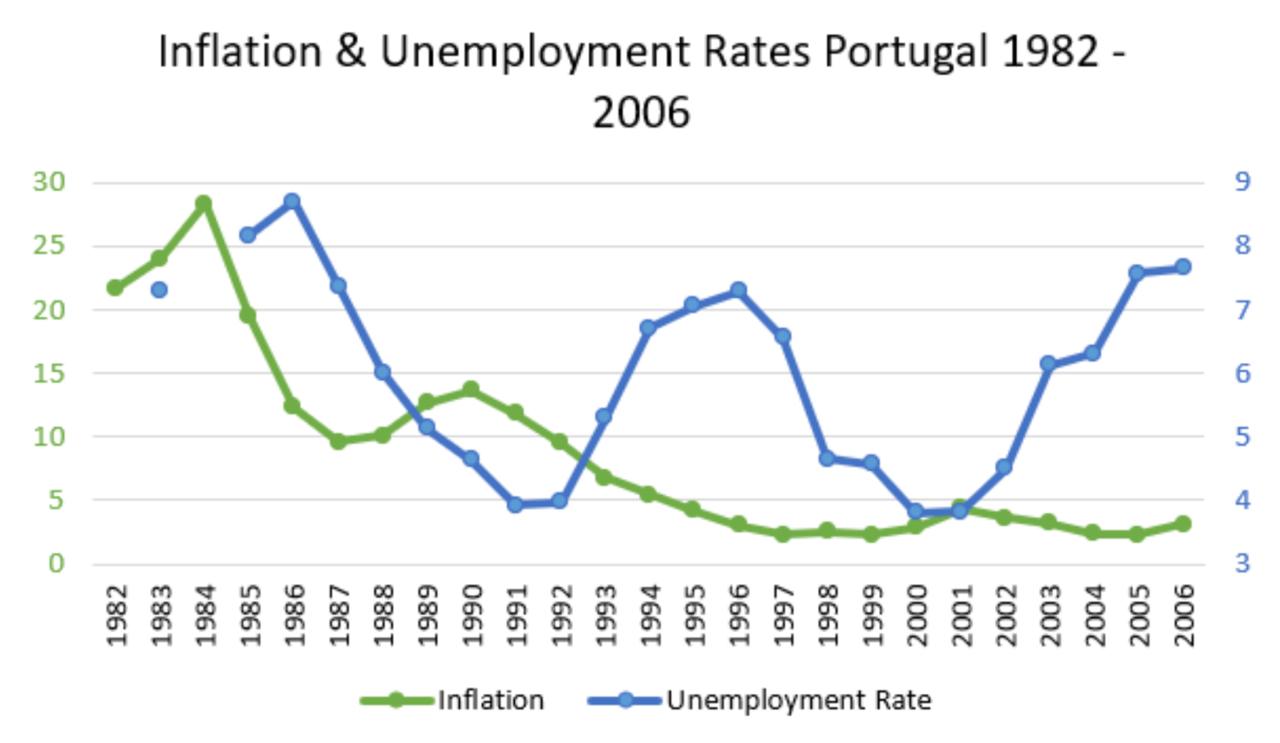
- Figure 2: Inflation and Unemployment Trends (1982–2006)
Phillips Curve Analysis
Original Phillips Curve
Initially, we construct the classical Phillips Curve by plotting annual inflation against the unemployment rate. The resulting scatter plot reveals significant anomalies and outliers—especially during the 1981–1985 period.
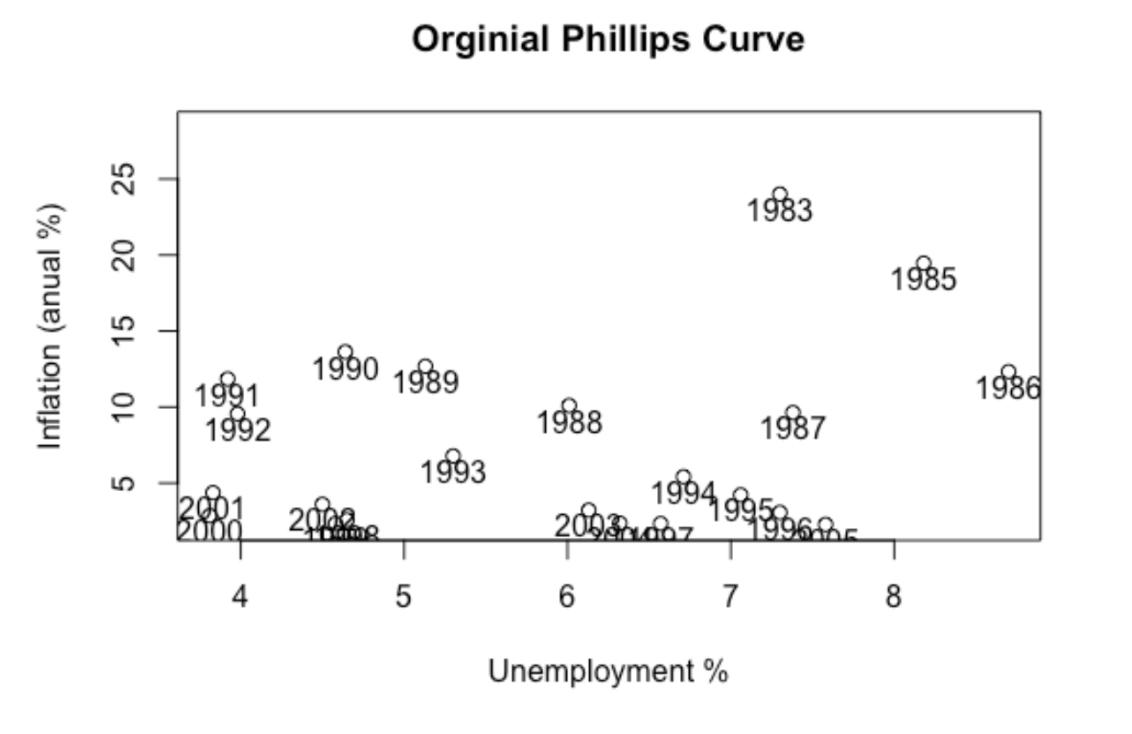 | 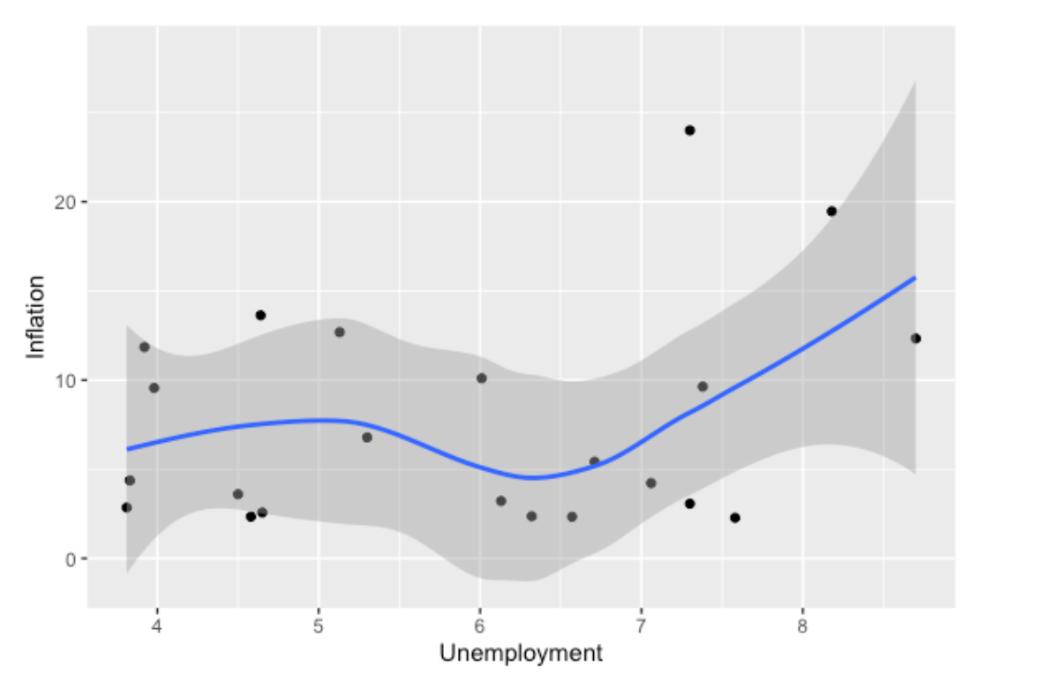 |
|---|---|
| Graph 1: Scatter Plot of Annual Inflation vs. Unemployment | Graph 2: Regression Analysis on the Original Phillips Curve with Smoothed Conditional Means |
Accelerated Phillips Curve
To address the distortions in the classical model, we redefine the relationship using the change in inflation (( \Delta \pi(t) )). The accelerated Phillips Curve shows a clearer negative correlation with unemployment, validated through rigorous regression analysis and robustness checks.
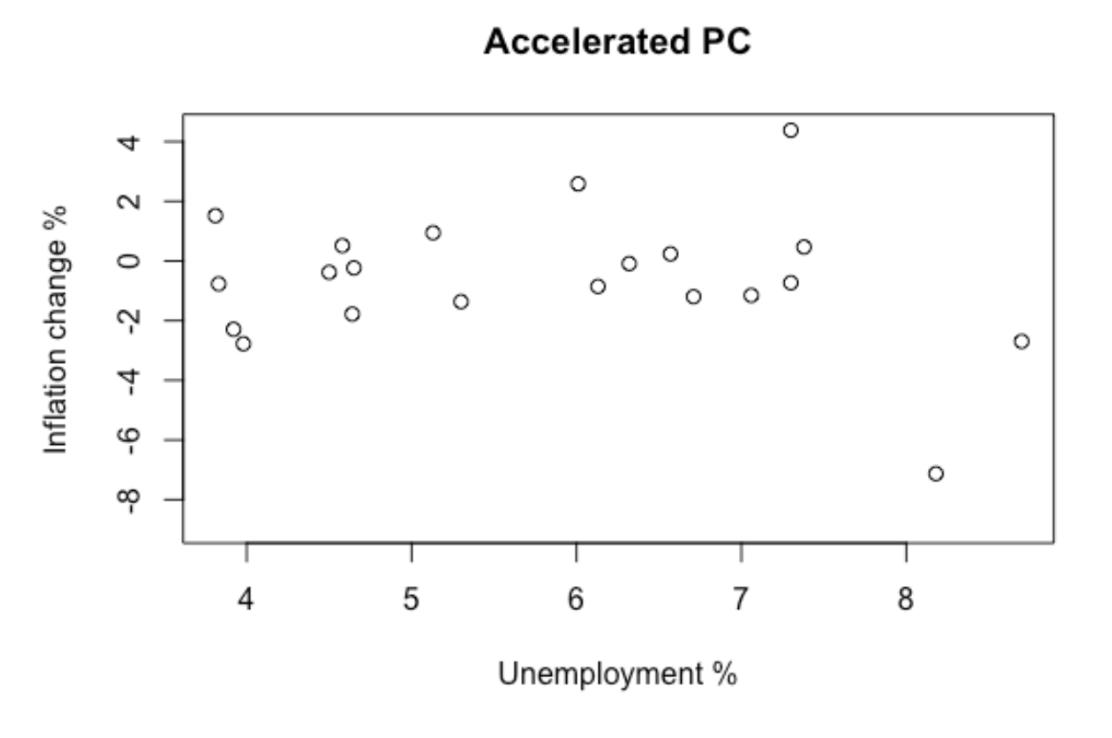 | 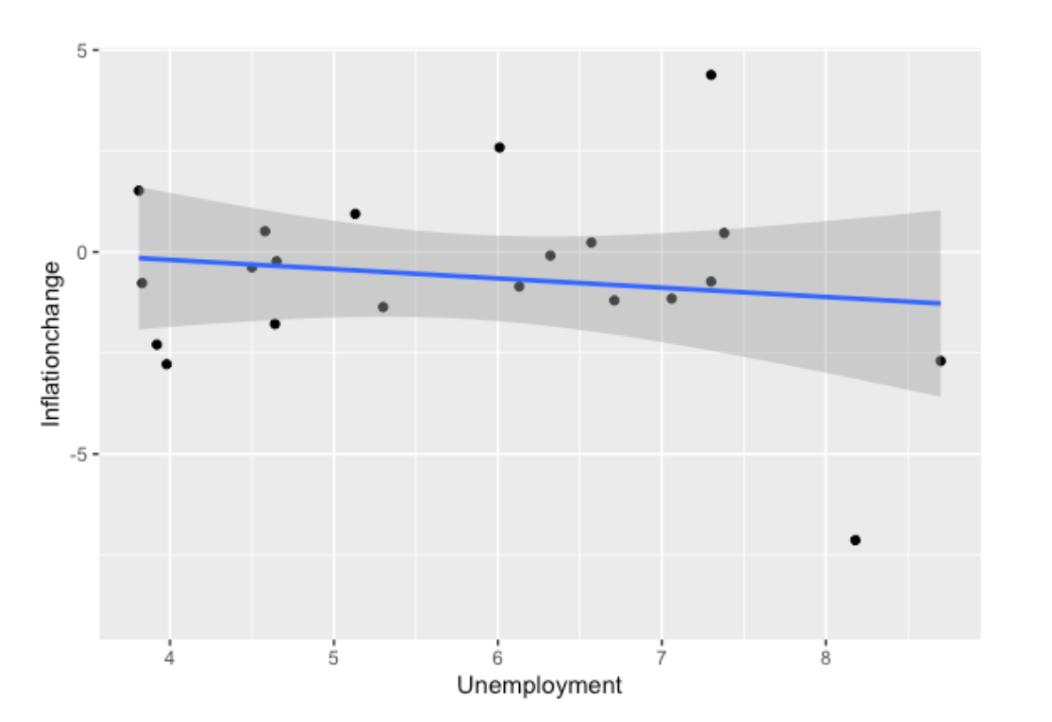 |
|---|---|
| Graph 3: Scatter Plot of Inflation Change vs. Unemployment | Graph 4: Linear Regression on the Accelerated Phillips Curve with Confidence Intervals |
Advanced Econometric Modeling
Vector Autoregression (VAR)
A VAR model is estimated to capture the interdependencies between GDP growth, unemployment, and inflation. Impulse response functions indicate that:
- A shock to GDP growth significantly affects both unemployment and inflation.
- The lag structure supports the hypothesis that monetary policy can mitigate these effects.
ARIMA Forecasting
An ARIMA model is applied to forecast future trends, providing insights into potential recession risks. Model diagnostics confirm the robustness of our forecasting framework, with residuals passing standard statistical tests for autocorrelation.
Discussion and Policy Implications
Interpretation of Empirical Findings
Our empirical analysis confirms that:
- GDP Growth: A sustained deviation below 3.5% is a reliable indicator of recession.
- Unemployment: Increases in unemployment lag behind GDP contractions, consistent with Okun’s Law.
- Inflation: Structural shifts necessitate an accelerated Phillips Curve framework for a more accurate depiction of inflation dynamics.
Policy Recommendations
The findings have profound implications for economic policy:
- Monetary Policy: The application of the Taylor Rule can help calibrate interest rates to stabilize the economy.
- Fiscal Interventions: Targeted fiscal stimulus during downturns can shift the aggregate demand curve rightward, mitigating recessionary pressures.
- Structural Reforms: Long-term strategies must address underlying structural imbalances exposed by our econometric analysis.
Investment and Economic Risk
For investors, understanding these macroeconomic dynamics is crucial. Our groundbreaking analysis provides a robust framework for quantifying country risk, thereby informing investment decisions and strategic asset allocation.
Conclusion
This blog post delivers a groundbreaking analysis of Portugal’s macroeconomic risk by integrating traditional economic theory with state-of-the-art econometric techniques. The study:
- Validates the use of GDP growth, unemployment, and inflation as key indicators of recession.
- Demonstrates the limitations of the classical Phillips Curve, proposing an accelerated model that better fits the Portuguese data.
- Employs advanced models such as VAR and ARIMA to capture dynamic interrelationships and forecast future risks.
Our findings offer valuable insights for policymakers and investors alike, paving the way for more informed and effective economic interventions. Future research may extend this framework to assess the impact of global shocks on emerging economies.
References
- CFI. (2015). What is a recession? CFI Recession :contentReference[oaicite:0]{index=0}
- The World Bank. (n.d.). GDP Portugal. World Bank GDP Data :contentReference[oaicite:1]{index=1}
- Friedman, M. (1968). The Role of Monetary Policy. American Economic Review.
- Phillips, A.W. (1958). The Relationship between Unemployment and the Rate of Change of Money Wage Rates in the United Kingdom. Economica.
- Additional peer-reviewed studies and working papers on structural breaks and VAR/ARIMA methodologies.